There are plenty of numbers capable of ruining an indie developer's morning. Burn rate. Wishlist conversion. Refund rate. The number of unfinished prototypes quietly decomposing inside a folder called NewGame_Final_v7.
This one might beat all of them.
A massive analysis of Steam's paid catalogue estimates that half of paid games have earned less than $3,622 in lifetime gross revenue. At the other end of the leaderboard, the top 1% account for roughly 84.5% of all estimated revenue, with entry into that top percentile starting at approximately $15.87 million.
Those figures come from The Steam Revenue Report, published by WeLoveIt.io on August 19, 2026.
Data source and credit: This article is based primarily on The Steam Revenue Report, compiled by Ichiro Lambe and Matt Martindale of Totally Human Media together with Dr. Tim Ermilov of VaporLens. The project is not affiliated with Valve. Its revenue figures are estimates based on public Steam review and pricing data, not Valve's private transaction records.
That distinction matters. It also does not make the graph any less savage.
The numbers at a glance
The snapshot published alongside the report analyzed roughly 99,000 paid Steam games and exposed a ridiculous gap between the typical release and the games sitting at the top.
| Metric | August 2026 report snapshot | What it tells us |
|---|---|---|
| Paid games analyzed | 99,206 | A massive sample of Steam's paid catalogue |
| Median estimated lifetime gross | $3,622 | Half of measured paid games were below this |
| 90th percentile | $236,184 | Only roughly 10% cleared this estimate |
| 99th percentile | $15,872,031 | Approximate entry point for the top 1% |
| Top 1% share of estimated revenue | 84.5% | Steam revenue is extremely concentrated |
| Paid games with zero reviews | 8,024 | Thousands sit below the method's useful measurement floor |
One thing worth knowing before screenshotting those numbers for the group chat: the report is live and refreshes continuously. At the time of writing, the live page shows 98,555 priced games with at least one review, a median estimated lifetime gross of $3,631, and 8,768 paid games with zero reviews.
So do not get stuck arguing over whether the magic number is $3,622 or $3,631. The important part is the shape of the curve, and the curve is brutal.
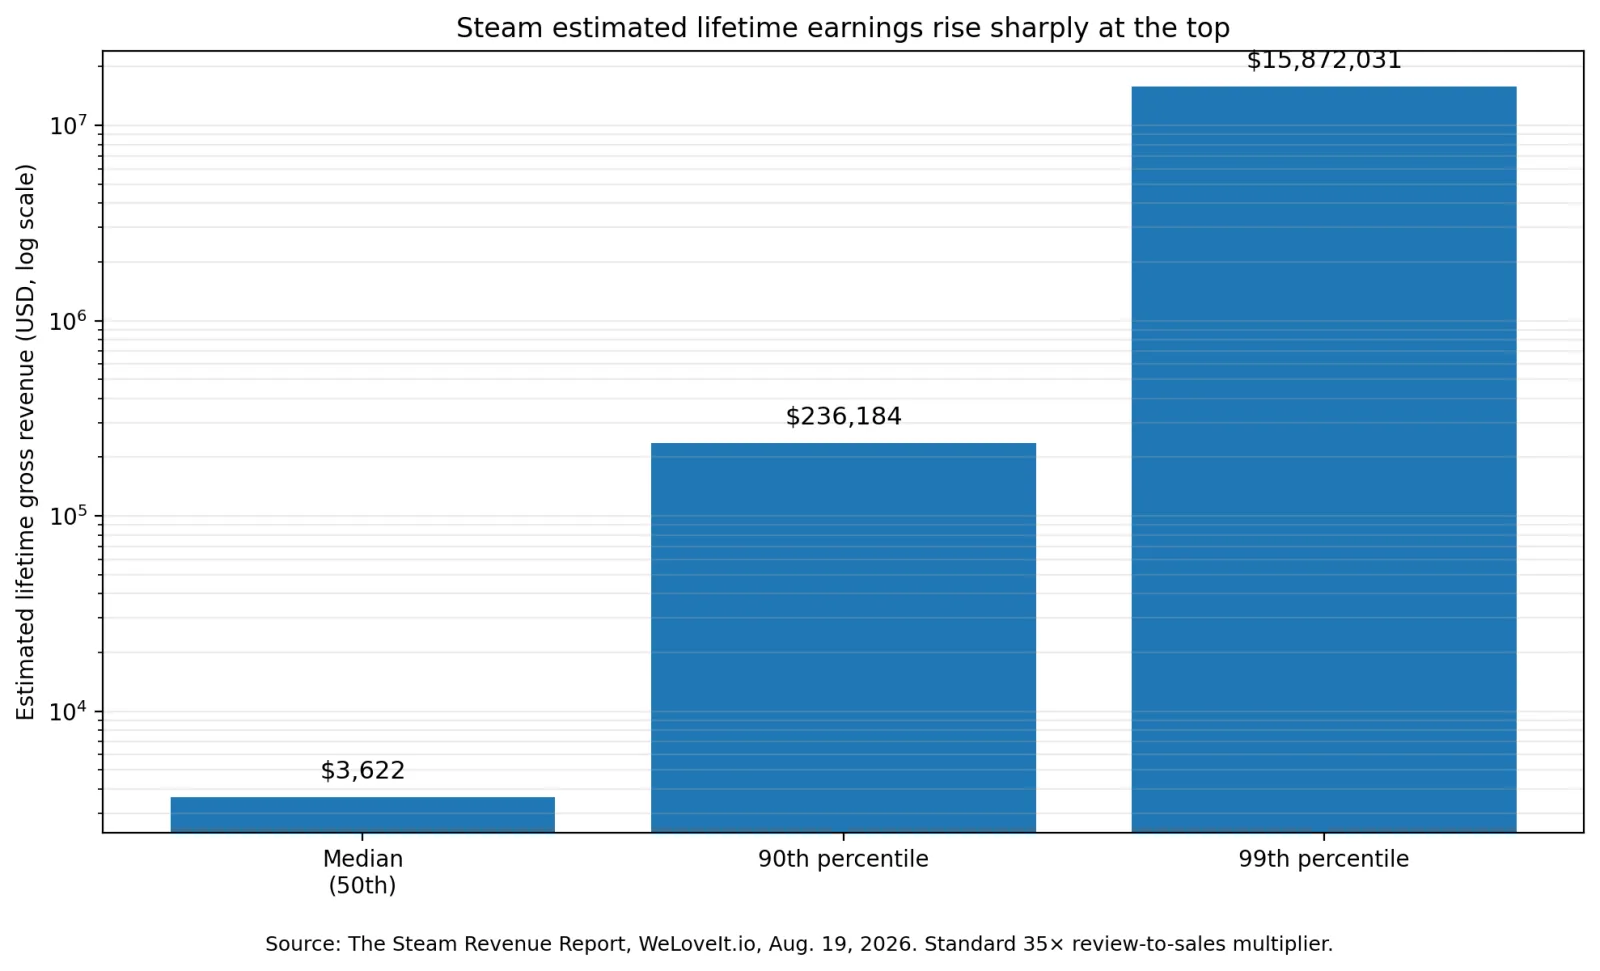
The Steam middle is much smaller than social media makes it look
The median figure is obviously the one built for a viral screenshot.
$3,622 lifetime gross.
Not launch week. Not first month. Lifetime.
But the next numbers are arguably more important. A game at the 90th percentile was estimated at approximately $236,184, around 65 times the median.
Then things get silly. The 99th percentile starts at roughly $15.87 million, around 67 times the 90th percentile estimate and more than 4,000 times the median.
| Position | Estimated lifetime gross | Rough multiple of median |
|---|---|---|
| Median | $3,622 | 1x |
| 90th percentile | $236,184 | 65x |
| 99th percentile | $15,872,031 | 4,382x |
This is why the top 1% statistic matters more than obsessing over the exact median. According to the report, the top 1% of games capture approximately 84.5% of all estimated paid game revenue.
Steam is not a neat RPG progression tree where another 20% effort gives you another 20% revenue. Commercially, it looks more like somebody dumped almost every stat point into the final few nodes. Most games stay near ground level. A tiny group finds the mountain.
More than 8,000 paid games had no reviews at all
There is another number hiding underneath the revenue headline. In the original snapshot, 8,024 paid games had no Steam reviews whatsoever.
The report is careful about what that means. Zero reviews does not automatically equal zero sales, because most Steam buyers never write reviews. The live report currently places 8,768 paid titles below that measurement floor and says those games probably earned something between effectively nothing and a few hundred dollars.
That is still rough. These are not random prototypes sitting unfinished on somebody's SSD. They are games that made it to Steam. Somebody created the store assets, paid the Steam Direct fee, uploaded builds, configured the listing, passed release checks and pressed the big green button. Then almost nobody left a public trace that they had played them.
For all the anxiety developers have around negative Steam reviews, there is arguably something worse: silence. A bad review at least means somebody found the game.
Steam is getting dramatically more crowded
The revenue numbers become even more interesting when you put them next to release volume.
| Release year | Games released |
|---|---|
| 2018 | 7,427 |
| 2024 | 19,714 |
| 2025 | 23,107 |
| 2026 | 15,814 so far in the August snapshot |
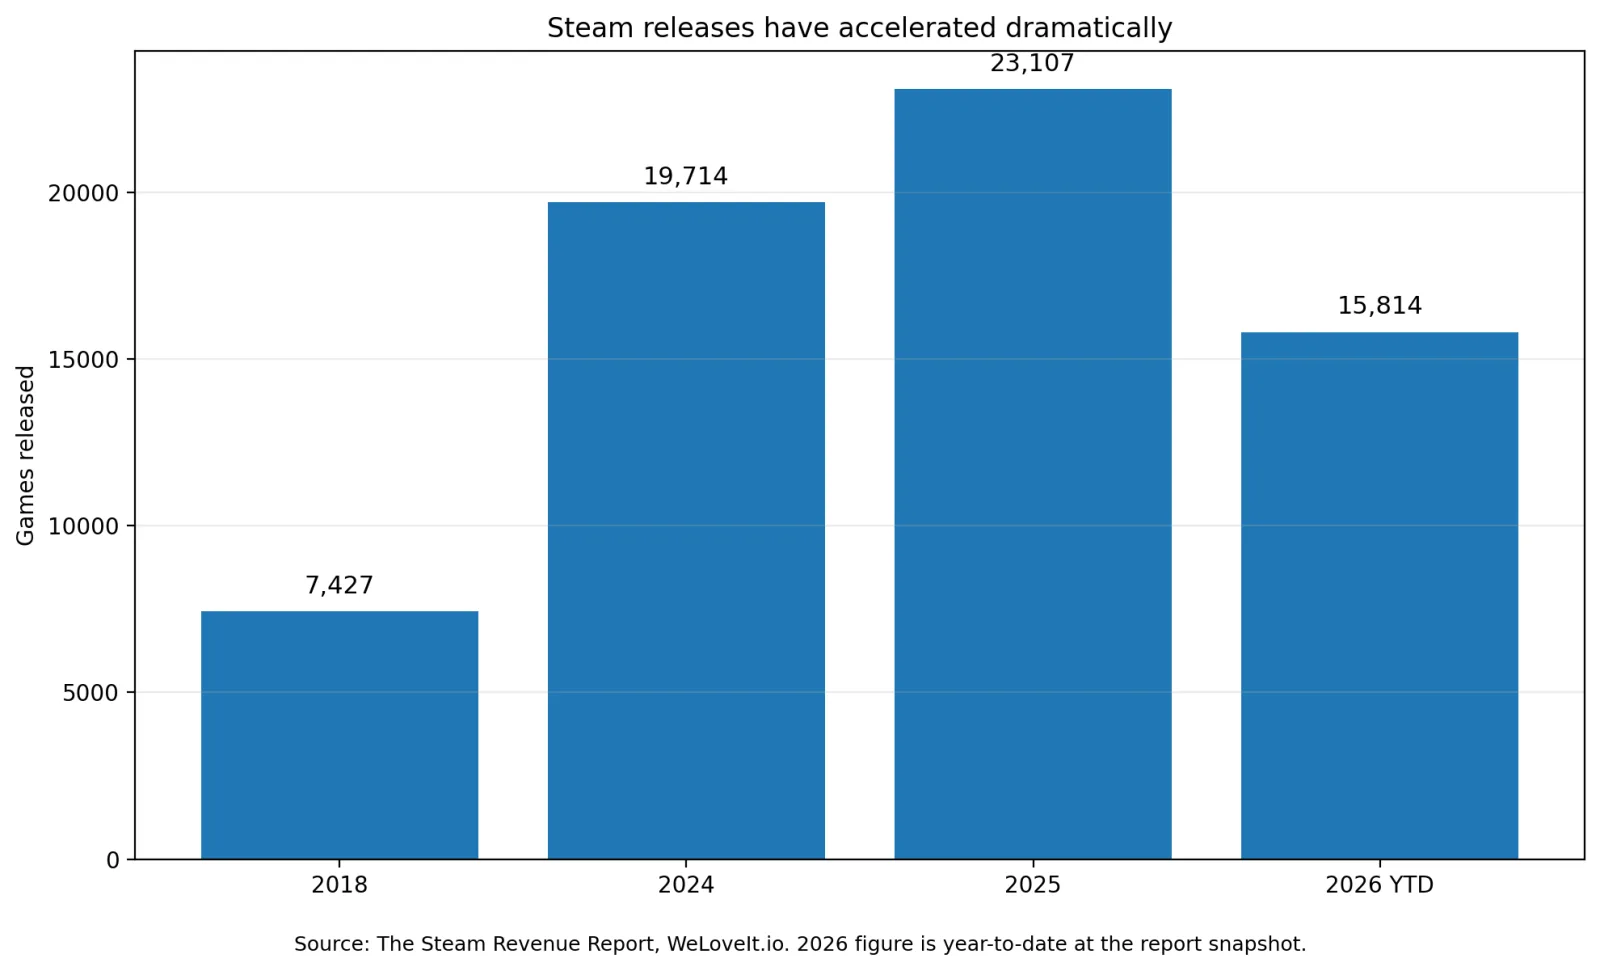
Steam went from 7,427 releases in 2018 to 23,107 in 2025, more than triple the number of games fighting for attention. By the August 2026 snapshot, another 15,814 games had already launched during 2026, with several busy months still left in the year.
None of this means Steam suddenly became a bad place to release an indie game. The opposite is probably closer to reality. PC gaming is massive, and Steam provides tiny teams with access to a worldwide market that would have been almost unimaginable for independent developers a couple of decades ago.
The problem is that everybody else discovered the same thing. Uploading a game to Steam is no longer the difficult part. Getting anyone to notice it is.
How The Steam Revenue Report calculates the money
Before anyone converts "$3,622" into a universal law of indie development, we need to talk about how the report gets there.
Valve does not publish sales figures for every Steam game. The researchers therefore use a variation of the Boxleiter method, which treats Steam review counts as a rough proxy for copies sold. The report's standard model assumes:
Estimated copies sold = Steam reviews x 35
Those estimated copies are then multiplied by the game's current US list price. Imagine a game has 100 Steam reviews and currently costs $10.
| Calculation | Result |
|---|---|
| Steam reviews | 100 |
| Standard multiplier | 35x |
| Estimated copies sold | 3,500 |
| Current US price | $10 |
| Estimated lifetime gross | $35,000 |
Nice clean number. Not a bank statement.
The report actually lets readers change the multiplier. There is a conservative 20x setting, the standard 35x setting and a generous 50x setting. The methodology notes that realistic review to sales relationships can range even wider depending on the genre, price, audience and era in which a game was released.
That creates a fairly chunky error bar for individual titles. Across almost 100,000 games, however, the aggregated data can still reveal something extremely useful: the shape of the marketplace.
Gross revenue is not what reaches the developer's bank account
There is another mistake that is easy to make when reading the report.
Gross revenue is not developer income.
Suppose that $35,000 example above were exactly correct. That still would not mean the developer received $35,000.
Valve's platform share exists. Taxes exist. VAT exists in many territories. Refunds exist. Chargebacks exist. Publishers might exist. Contractors definitely remember sending invoices. Marketing certainly does.
The report itself explicitly warns readers about this. Even before considering development costs, the amount reaching a studio is smaller than estimated gross revenue. So when you see the $3,622 median, do not translate that into "the average indie developer earned $3,622." That is not what the dataset says.
The methodology has some serious blind spots
One of the strongest things about The Steam Revenue Report is that its creators do not hide the limitations in a tiny footnote. They give them an entire section. Here are the big ones.
| Limitation | Why it matters |
|---|---|
| Current list price | A $20 game may have sold most copies for $5, $10 or $15 during discounts |
| US pricing | Regional Steam prices can be substantially lower |
| Refunds and chargebacks | Gross estimates are not settled developer revenue |
| DLC | Add on content revenue is not included |
| Bundles | Bundle sales cannot be reconstructed accurately |
| Free to play | Huge games such as Counter Strike, Dota and Warframe cannot be measured using price multiplied by reviews |
| Review rate differences | A cheap impulse purchase and a $60 game may produce reviews at very different rates |
| Historical changes | Steam users do not necessarily review games at the same rate today as they did ten years ago |
| Zero review games | There is no useful review count from which to estimate sales |
The report currently counts more than 18,000 free games in the wider Steam catalogue, but does not estimate their revenue at all. That removes some massive businesses from the analysis. Counter Strike is a fairly obvious example. Multiplying its base game price by reviews would be spectacularly useless when the base game is free and the money comes from an entirely different ecosystem.
Price history is another nasty one. Imagine a game launched for $20 five years ago and it still costs $20 today. Maybe half of its buyers picked it up during $5 Steam sales. Using $20 for every estimated lifetime copy is obviously going to overshoot, and the report acknowledges exactly that problem.
So no, these numbers are not precise enough to tell you how much a specific developer has in their company account.
The 84.5% figure is the actual boss fight
Now we get to the number I think indie developers should care about most.
84.5%.
That is the estimated share of revenue captured by the top 1% of paid games.
Change the Boxleiter multiplier and the estimated dollar amounts move. Use 20x instead of 35x and they fall. Use 50x and they rise. The concentration remains, because scaling everybody up or down does not magically flatten the distribution.
The report describes one of its visualizations particularly well. On a logarithmic chart, you can actually see the enormous field of games. Switch to linear revenue and almost everything collapses into a line near the bottom while a tiny number of hits remain visible. That might be the most useful mental image in the entire report.
Steam is a winner take most market.
That does not mean only AAA games win. Far from it. Some of Steam's biggest stories came from independent developers: Stardew Valley, Terraria, Vampire Survivors, Valheim, Among Us, Palworld.
The existence of those games proves that an indie can absolutely break through. Their fame also proves how unusual breaking through actually is.
Indie development has a survivorship bias problem
Spend enough time around indie dev Twitter, Reddit, YouTube or postmortem blogs and your perception of commercial success starts getting weird. Successful developers have interesting graphs, so they post them.
A game makes $100,000 and gets a postmortem. A tiny team crosses a million copies and every gaming site wants the story. A four month prototype goes viral and suddenly everybody is wondering whether they are overthinking their own three year project. Nobody races to write:
"I spent two years making this game and sold 47 copies."
That creates a massive survivorship bias. We recently looked at the opposite end of the spectrum in our fastest rising indie games of 2026, where tiny and mid sized teams produced some frankly stupid commercial numbers.
Those success stories are real. So are the thousands of games nobody noticed. Both things can exist at the same time, and that is what makes this report useful. It puts the shiny loot drops and the empty chests onto the same map.
Making a good game is not enough
This is the uncomfortable bit. A technically solid game can fail. A beautiful game can fail. A game with positive reviews can fail.
You can spend three years polishing combat, rebuild the inventory system four times, rewrite your shaders, redo the tutorial and argue with yourself for two hours about three pixels of menu padding. None of that guarantees discovery.
For a commercial indie project, marketing cannot begin two weeks before release because somebody suddenly remembers the game needs a trailer. Finding the audience is part of developing the product.
- Who is the game for?
- What else do those players buy?
- How crowded is the genre?
- Does your core fantasy make sense from one screenshot?
- Does a ten second clip communicate why the game is interesting?
- Does the demo create wishlists?
- Does the Steam capsule stop a player scrolling?
- Do strangers understand what makes the game different without you standing behind them explaining it?
Those are development questions if you are trying to build a business.
Do not read this as "never make an indie game"
That would be the most NPC interpretation possible. Indie development is not dead. Steam is not dead. Players have not suddenly stopped buying games, and Steam still produces breakout indie hits constantly, including games built by one person or tiny teams.
The report is not saying that succeeding is impossible. It is saying that success is not the default outcome simply because you finished the game.
That distinction matters. There are also plenty of completely valid reasons to make a game that have nothing to do with maximizing revenue. Maybe you want the experience. Maybe it is a portfolio project. Maybe you have wanted to make that RPG since you were twelve. Maybe finishing something matters more than selling it. All good.
But "I need to make this game" and "this game has a strong commercial opportunity" are two different statements. Mixing them together is how people end up budgeting around sales that were never validated.
What indie developers should actually take from this report
The report is not a reason to panic. It is a reason to stop relying entirely on vibes.
Know your break even number
If your project costs $30,000 to build, then $10,000 gross is not a modest commercial success. It is a loss.
A solo developer making something over six weekends has a completely different risk profile. Know which game you are making.
Validate before the final build
Do not wait until launch to discover whether anyone understands the pitch. Show prototypes. Release a demo. Study competing games. Test capsule art. Track wishlists.
Watch what strangers actually do instead of asking friends whether the game "looks cool."
Understand the market around your genre
Genre is not destiny, but competition matters. A great idea entering an overcrowded market has a different commercial problem from a great idea serving an audience that is actively hunting for more games.
Market research does not mean cloning whatever currently sells. It means knowing what boss room you are walking into.
Treat discoverability as a system
There will always be luck involved when a game explodes. But Steam festivals, creator outreach, demos, wishlists, Discord communities, store conversion, updates, social clips and external discovery all give a project more chances to connect.
That is also the problem PokeIndie is trying to solve for developers. A game's entire future should not depend on whether the Steam algorithm loved its first 48 hours.
A map of the battlefield, not Valve's accounting books
The Steam Revenue Report does not reveal the exact revenue of every game on Steam, and its creators never claim that it does. What Ichiro Lambe, Matt Martindale and Dr. Tim Ermilov have built is something arguably more useful for indie developers than another isolated success story: a map of Steam's commercial landscape.
The map has fuzzy coordinates. Review multipliers vary. Prices change. Discounts distort things. Regional sales complicate the math. But when almost 100,000 games are placed on the same map, one thing becomes difficult to ignore.
The market is enormous. The opportunity is enormous. And the distance between "I shipped a Steam game" and "I built a commercially successful Steam game" is also enormous.
Steam has never made it easier for a tiny developer to put a game in front of a global PC audience. It has also never contained this many other developers fighting for that player's next click.
That is the opportunity. That is also the boss fight.
Source and methodology
The primary source for the statistics and methodology discussed in this article is The Steam Revenue Report, WeLoveIt.io, August 19, 2026.
The report was compiled by Ichiro Lambe and Matt Martindale of Totally Human Media and Dr. Tim Ermilov of VaporLens. It is not affiliated with Valve. Revenue figures are estimates based on publicly available Steam review counts and pricing data using a configurable Boxleiter style review to sales multiplier.
Because the underlying dataset refreshes continuously, some live figures may differ slightly from the August 19 snapshot quoted throughout this article.
 Written by
MML Tech →
Written by
MML Tech →